Prevalence Of Learning Disabilities:
* Around 1 million children ages 6-21 have a learning disability and receive special education services.
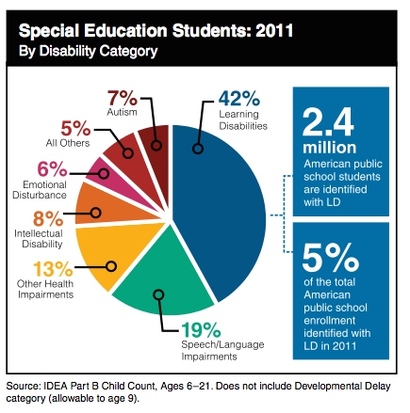
* 1/3 of children receiving special education services include students with learning disabilities.
* There are more students with learning disabilities than any other disability.
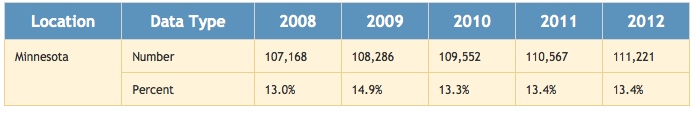
* Numbers of students with disabilities vary widely state to state depending on the methods used to determine eligibility.
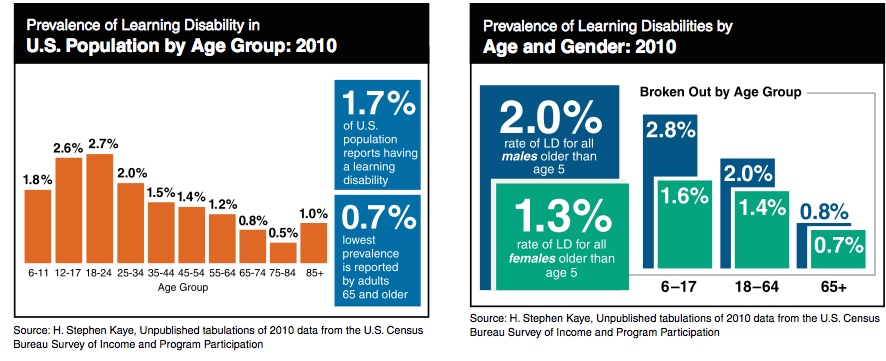
* Males are twice as likely as females to be diagnosed with a learning disability.
* 59% of students with learning disabilities are spending more than 80% of the school day in general education classrooms.
* The learning disability category under IDEA was passed into law in 1975.
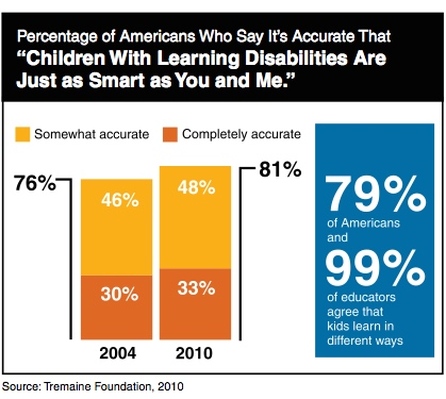
* Almost 2/3 of people know someone who has a learning disability.
* Almost 2/3 of parents say that their child's school doesn't provide information on learning disabilities.
* 1/3 of parents significantly struggle with their attitude toward and ability to cope with their child's learning disability.
* Blacks and Hispanic students are overrepresented in many states while white and Asian students are underrepresented in the LD category
* The lowest rate of LD is reported among Asians.
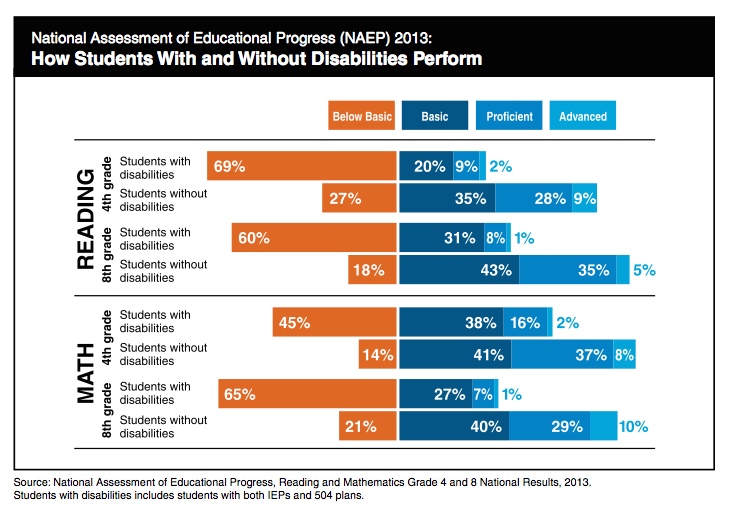
* 68% of students with LD leave high school with a regular diploma.
* 67% of young adults with LD will enroll in postsecondary education.
* 46% of working-age adults with LD report being employed.
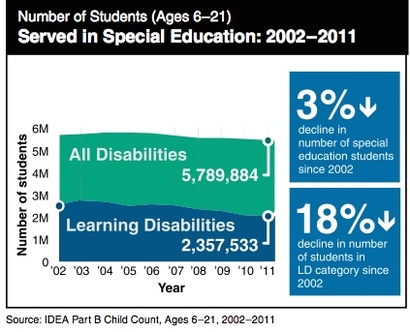
* 2,357,000 people between ages 3-21 were reported to have a learning disability in the year 2010-2011 compared to the 796,000 people
reported with a learning disability in the year 1976-1977.
(National Center for Education Statistics, 2013)
* 1/3 of children receiving special education services include students with learning disabilities.
* There are more students with learning disabilities than any other disability.
* Numbers of students with disabilities vary widely state to state depending on the methods used to determine eligibility.
* Males are twice as likely as females to be diagnosed with a learning disability.
* 59% of students with learning disabilities are spending more than 80% of the school day in general education classrooms.
* The learning disability category under IDEA was passed into law in 1975.
* Almost 2/3 of people know someone who has a learning disability.
* Almost 2/3 of parents say that their child's school doesn't provide information on learning disabilities.
* 1/3 of parents significantly struggle with their attitude toward and ability to cope with their child's learning disability.
* Blacks and Hispanic students are overrepresented in many states while white and Asian students are underrepresented in the LD category
* The lowest rate of LD is reported among Asians.
* 68% of students with LD leave high school with a regular diploma.
* 67% of young adults with LD will enroll in postsecondary education.
* 46% of working-age adults with LD report being employed.
* 2,357,000 people between ages 3-21 were reported to have a learning disability in the year 2010-2011 compared to the 796,000 people
reported with a learning disability in the year 1976-1977.
(National Center for Education Statistics, 2013)
Statistical Graphs Related To Learning Disabilities:
|
|
Disabilities in Minnesota:
Special Education District Profile:
Owatonna Public Schools
* 41.5% of students ages 3-5 with a diagnosed disability attend a regular early childhood program and receive the majority of special
education services in the regular early childhood program (2012-2013 school yr)
* 68.6% of students ages 6-21 on IEPs are served inside the regular general education class 80% or more of the day (2012-2013 school yr)
* 99.7% of students on IEPs in the Owatonna school district participate in statewide assessments (2012-2013 school yr)
* 63.4% of students on IEPs in the Owatonna school district graduate high school in 4 years with a regular diploma (2011-2012 school yr)
* 100% of students who were on IEPs as youths are now either enrolled in higher education, postsecondary education/ training program, or
competitively employed (2009-2010 school yr)
* 57.1% of parents reported being involved in improving services for their child on an IEP (2009-2010 school yr)
* 2.34% of children from birth to age three are on Individual Family Service Plans, receiving early intervention services (2012-2013 school yr)
(Minnesota Department of Education- Data Reports and Analytics, 2015)
Dyslexia:
|
* The most common language based learning disability is dyslexia
* 70-80% of people with poor reading skills are likely to be dyslexic * Dyslexia is most common cause of reading, spelling, and writing difficulty * Prevalence of dyslexia in males and females is fairly equal * Prevalence of dyslexia among different ethnic and socioeconomic backgrounds is nearly the same * High poverty schools include children at risk for reading failure * 20% of students in elementary school are struggling with reading nationwide * 30% of children with dyslexia are also diagnosed with AD/HD. (The Dyslexia Center of Utah, 2015) |

|
Dyscalculia:
|
* Several children with reading disorders also have lowered math
achievement, while several children with a math disability have lowered reading skills as well * Dyscalculia is typically as common in girls as it is in boys * Occurs in approximately 5-6% of the school-age population * Dyscalculia is understudied and under-resourced compared to dyslexia (NCBI, 2004) |

|
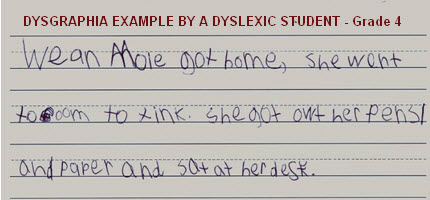
Dysgraphia:
|
* Dysgraphia tends to occur when students are first introduced to
writing * Children can have other learning disabilities along with dysgraphia * Students with dysgraphia are capable of having a higher IQ than average * The exact percentage of students with dygraphia is unknown, as research in this area is limited and unclear * Often children will have multiple types of dysgraphia * Dysgraphia can be more common in languages such as English and French because they tend to be less phonetic compared to other languages. (Handwriting Problem Solutions, 2015) |
|
